|
||||||||||||||||||||||
|
Introduction The listening environment at home is no different. Each room imparts a sonic character to the reproduced sound. A large empty room, for example, will sound bright. And you can buy the most expensive equipment that you want, but doing so will not eradicate the problem. The same goes for your listening position. Where you sit determines what you hear. The one flexibility you have in your room, as opposed to a concert hall, is that your chair can be moved. A little experimenting can go a long way towards making the music sound better. But is there any science behind this? Of course! Let us start with “Resonance”. Several musical instruments operate on the principal of resonance. Well guess what, your room also resonates at certain frequencies. The room dimensions determine the resonant frequencies. To compute the fundamental resonant frequency, or resonant mode, of a given dimension of your room, you can use the following formula: 1130/(2L), where 1130 is the speed of sound in air, measured in feet/second, and L is the length of that dimension in feet. The other resonant modes are simply integer multiples of the fundamental. But, why talk about resonance? Resonant frequencies create standing waves in a closed room. These waves are created through interference between the forward propagated waves from the speaker and the reflected waves from the walls. At certain positions in the room we get constructive interference. At these locations, the resonant frequencies will sound louder relative to other frequencies. And at some other locations we get destructive interference. These locations present an acoustic null and you simply don't hear these frequencies. Increasing the volume will not help, and neither will an equalizer. Moving the chair, however, can do wonders! So, how can we make our room sound good, and what is
the best listening position? Well, leave that to CARA Software CARA stands for
Computer Aided Room Acoustics. It is a program that uses a three-dimensional
model of your listening environment to determine optimal placements for the
listener and the loudspeakers. The user builds the model using the supplied
CAD tools. The computational engine then takes cares of everything else! ELAC Technische Software (ETS) in Germany developed the CARA software. ETS was founded in 1990, and it has three full-time employees and an occasional intern. The employees are experts in Mathematics and programming. CARA is sold in the US through Rhintek, Inc. Rhintek
was founded in 1977, and they have developed several system software
products like compilers, programming editors, graphics packages, and terminal
editors. CARA is the first software product that they have not
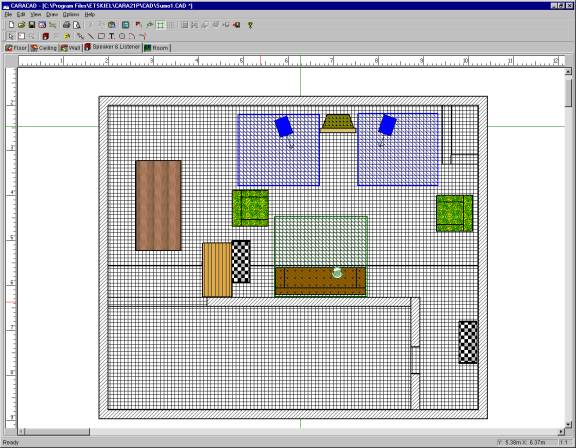
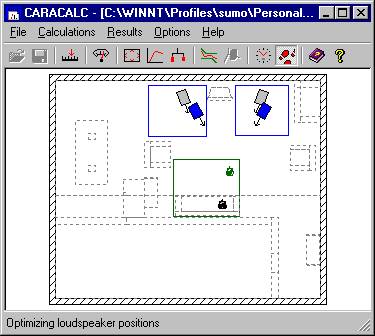
developed in house. As is my usual tendency when reviewing products, I started out without reading the printed manual. It did not take me long to realize that this was a bad idea! So, I popped open the online help page. Right away, I was impressed by the comprehensive nature of this document. I found it to be quite refreshing, and actually found myself spending a good deal of time reading the online documentation. If you do decide to buy this product, I highly recommend that you spend some time reading the help section before proceeding to do anything. If not, you, like myself, will become frustrated very quickly. (There is an acronym for reading the manual, but I will leave it to the reader's imagination to figure out what that might be!) The Metric System CARA was developed in Germany, and as a result, all the dimensions are entered in metric units. You can, however, press “F10” in an input field, and a conversion window pops up allowing you to enter the dimension in one of several units (see picture below). I wish that one could just set a preference somewhere, and the software would perform the conversion internally. Let's hope for that in a future version. There were a couple of times when I forgot to bring up the conversion window, and input “feet” instead of “cm”. This was a touch bothersome. Although the metric system - which was developed during the French Revolution - was legalized for use in the United States in 1866, congressional legislation defeated its exclusive use by one vote, so we still have to deal with all these different measurement standards. To make it easier, you can go to various websites, such as this one, and obtain conversion values for whatever you want. The first thing you do in CARA is to create a 3D model of your listening environment. If your room is rectangular or L-shaped, you are in luck, since there is a wizard that guides you through this process. If your room has some other shape, the task is a bit more daunting, and you should start reading the manual ASAP. Note here that the length and width of your room can be changed at any time; however, the height is etched in stone once you exit the wizard. If you want to change the height, you must start from scratch! Once you are done designing the room, you start filling it with furniture. Several pre-designed furniture pieces are provided. If you can't find one you need, you can design one. This is done using a “3D Object”. When creating an object, you also define what material that object is made up of. CARA has an extensive list of materials, complete with their sound absorption coefficients at each wavelength. If a material is missing, you can create a custom material and enter its sound absorption coefficients at each wavelength. Now this is flexibility! You then position the listener and the loudspeakers. For both the listener and the loudspeakers you specify a bounding box, which is an area that you are willing to place speakers or your listening chair. The program is only allowed to find an optimum position within this bounding box. If you want, you can impose symmetry constraints to have the optimized speaker locations be equidistant from the sidewalls and/or front wall. Below is a two-dimensional view of my listening environment. I also experimented with speakers positioned along the longer axis, although I have not included that picture here. The blue and green shaded regions represent the bounding boxes for the speakers and listener respectively. CARA can also be used in a surround setup, although I chose to stick with a stereo setup. As you will see later, the computation times were so long that my computer had its hands full just trying to run the optimization for this setup.
The picture below is CARA's three-dimensional rendering of my listening environment from the CAD model. You can move around the room and change the viewpoint. This is very cool! The material behind the speakers is foam, and the red structure to the right of the room is my attempt to draw our brick fireplace. It took some time and a fair bit of frustration to get to this stage. The online help section is excellent, and I found myself referencing to it almost constantly the first few times I used the software.
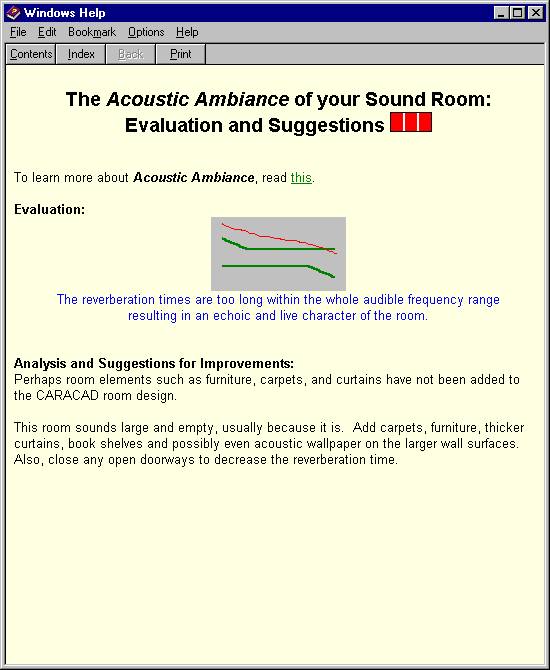
Loudspeaker Editor The first plot shows the reverb times in my room with no room treatment. My room is fairly large, and when I have no treatment, it sounds too bright. The plot below confirms that. The reverberation times are too high in the entire audible range. The suggestions are to fill it with more furniture or to use some acoustic treatment.
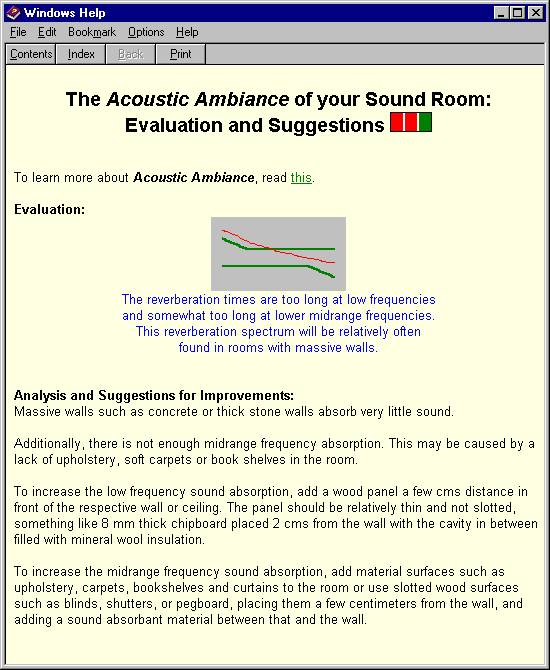
The second plot (below) shows the reverberation times when I place 1” thick foam behind the speakers. You can see that the problem in the mid to upper treble region has been fixed, but there still is a problem in the bass to upper mid-bass region. This is to be expected since foam is only effective at absorbing frequencies above 500 Hz. One can use Helmholtz resonators to tame problem frequencies below 500 Hz. I plan on fixing this problem frequency range in the near future. With the foam installed, however, the brightness in the room is reduced. I like it when data correlates with what I perceive!
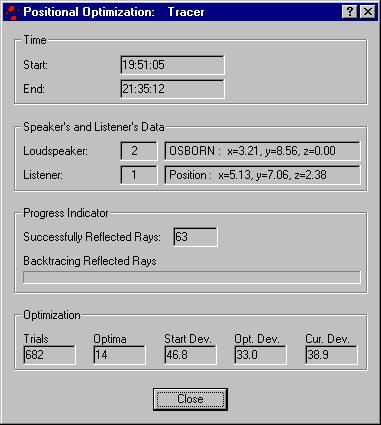
Loudspeaker and Listener Optimization You will need to experiment to find the number that finds a solution in a reasonable amount of time. Once the calculations commence, you see a window like the one shown below. This window shows you the number of trials that the program has gone through, and a measure of how good the current solution is. Note that this is an optimization program, and it is therefore an iterative process. And like all optimization programs, the starting point is important. I found different solutions if the speakers were positioned at a different location within the bounding box. So, start out by placing your speakers at some reasonable location. One other thing I noticed was that the “Current Deviation” number would occasionally increase. One would expect this number to converge to the “Optimum Deviation.”, however, this was not always the case. My guess is that this is an attempt to keep the system from getting stuck in a local minimum. This is a problem that several optimization algorithms suffer from. If this happens a lot, simply break the calculation. According to the manual:“If not interrupted by the user, the optimizing process runs 10,000 times. After about 100-500 processing runs, a very good position will be given. The probability of finding better variants constantly decreases with each successive run. The user may interrupt at any time.”
One really neat feature of this program is that it displays the optimized
location for the speakers and the listener relative to the starting position
at each trial. You can also view the improvement in the frequency response
at each trial. I just found myself sitting and gazing at the screen as the
speakers and the listener moved on the screen. The Results
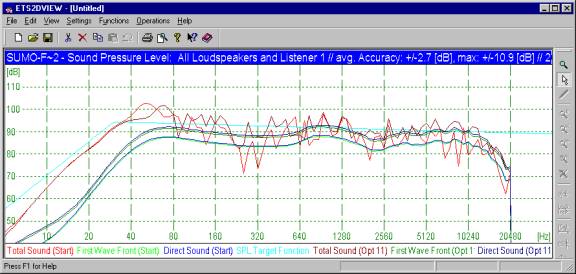
What about the frequency response? The curve in “Aqua” is the “SPL Target Function”, and this can be modified to whatever shape you want. The other curves are the before and after response curves for the direct, first wave front, and total sound.
The plot above
depicts what CARA estimates the improvement to be. Let us start by looking
at the bass region. There is a significant difference from 20 Hz - 40 Hz
between the total sound curves and the direct sound curves. This effect is
purely due to the room! Now look around 320 Hz and 2.5 kHz. You can see some valleys in the red curve. The optimized curve for the total sound smoothens this unevenness out to some extent. I wanted to see if this effect was measurable, so out came my trusty Radio Shack SPL meter. I played some test tones and sure enough some improvements, ranging from 2-4 dB, registered on the meter when I moved the speakers and myself to the suggested locations. This was a pleasant surprise! CARA really works! If only my computer gave me the luxury of increasing the “maximum reflection order”, I could perhaps have the program come up with an even better solution. Hmm, I need to work on a CPU upgrade. Another calculation that CARA can perform is the Sound Field Calculation. This calculation computes the relationship between position and frequency. The result is presented as a 3D graph, which is often referred to as the “modal landscape”. In this graph, the z-axis represents the magnitude of the sound-pressure amplitude for a given (x,y) location in the room. The computation is performed for 118 frequency values ranging from 5 Hz - 40 Hz, 960 Hz in 1/3-third steps. CARA provides a control pad, shown in the lower right corner of the graph below. Pressing “Play” steps through the plots at the measured frequencies in sequence.
Sound Field Calculation
The graph above shows the frequency-position dependence at 80 Hz. The location of the speakers and the listener at the optimized locations is also shown. This frequency was chosen because the peaks and valleys are much easier to see at longer wavelengths. Also, there is a room mode around 80 Hz, which makes the peaks very obvious. In this picture, the peaks, which appear at the room boundaries, correspond to areas where the wave interference is constructive. The valleys, which appear in the middle of the room, correspond to areas where the wave interference is destructive. Recall the principle of resonance that we started with!
I have seen similar “modal landscapes” before, but never for my own listening environment! I can now see the sound wave interactions in my room at 118 frequencies. For me, this is both exciting and informative. Conclusions
- Sumit
Chawla -
|
||||||||||||||||||||||


Magazine Publishing Solutions by