The following graphs show how
much noise there is in the images. It is performed by photographing a gray
scale step chart, which has gray rectangular patches going from white to black, with
various gray levels in between. I used an ISO of 100 for all the tests.
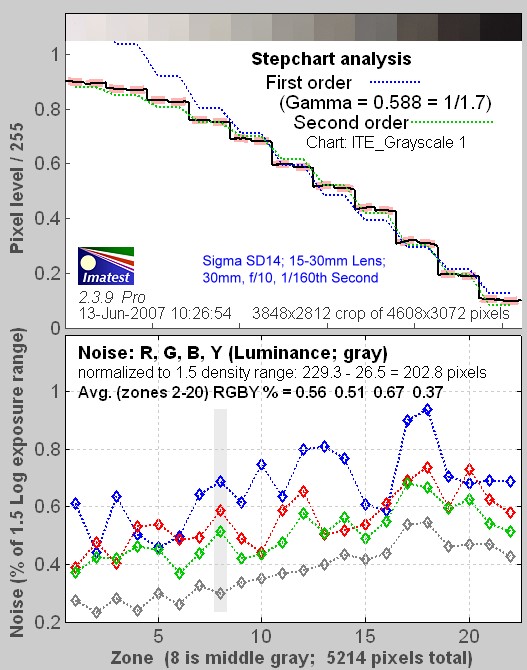
First, the Sigma SD14. The top
graph shows the average density of the grayscale patches (black line) and
the first order (blue dotted line) and second order (green dotted line)
density fits. In this case, the average
aligns with the second order fit, which means that the camera rolls off its
response to bright regions in a scene so as not to blow out the highlights.
The other two cameras here (Canon and Samsung) also do this, as do consumer digital
cameras in general. You can see that the Samsung rolls off its response just
a bit more than the Sigma or Canon.
In the
bottom graph the highest noise is in the blue channel, ranging from 0.6% to
0.93%. (% noise is shown on the Y axis, gray level zones are on the X axis,
with zone 1 being the lightest and higher zones being darker.)
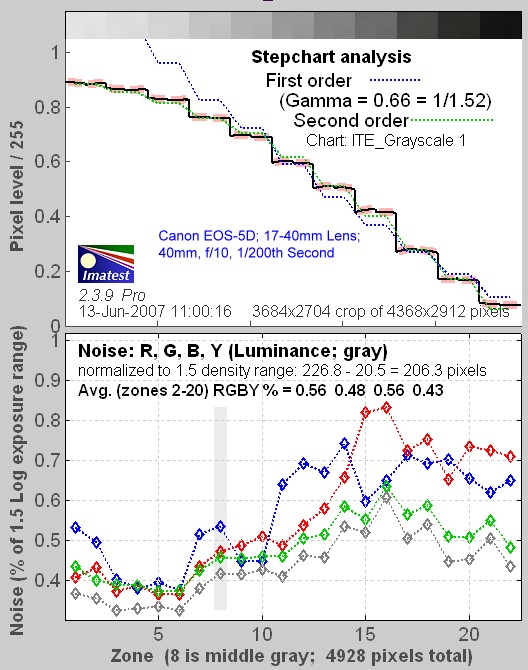
For the Canon EOS-5D, noise was
highest in the blue channel for most of the gray levels, and part of the
time, it was highest in the red channel. Noise ranged from a low of 0.4% to
a high of 0.87%. This is slightly better than the Sigma SD14, and
predictable based on the fact that the Canon sensor is much larger (noise
goes down as the sensor size goes up, and goes up as the number of pixels
increases on the same sized sensor).
So, we would predict that noise
on the Samsung NV10, which has a smaller sensor than either the Samsung or
Canon, would be higher, and it is. The red channel has the highest noise,
and ranges from a low of 0.94% to a high of 1.82%.

Because the noise at ISO 100 is
lowest for the Canon, and highest for the Samsung, with the Sigma in
between, we would expect the same order for performance at higher ISOs, such
as ISO 800. Thus, the Sigma would be the middle candidate for use in low
light where you needed to set the ISO at a high number.
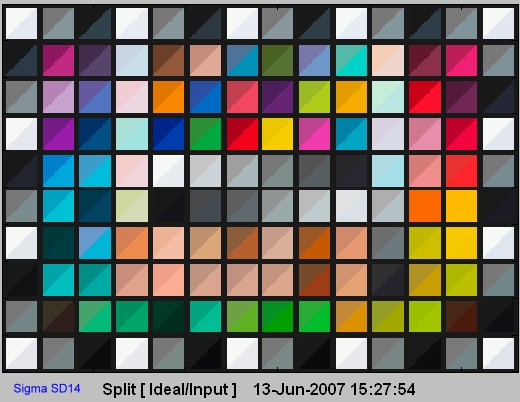
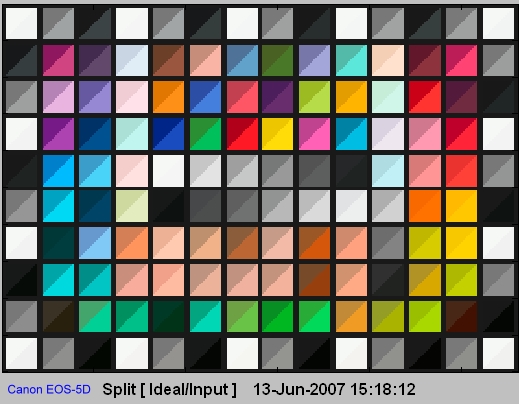
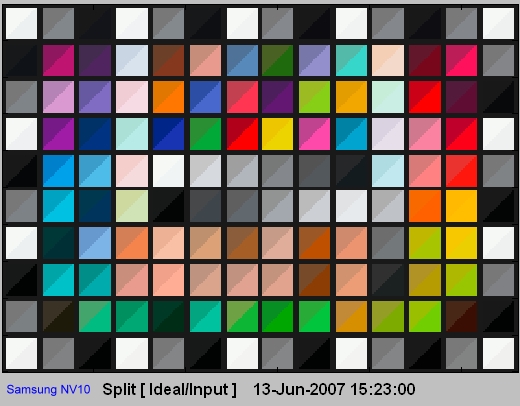
Below are Sigma, Canon, and
Samsung tests using a Gretag Macbeth ColorChecker
SG color chart, which has 140 colored squares. The test results are a combination of
what the colored squares should look like (the Gretag Macbeth standard) and
how the camera photographed them (JPEG output). The photos are split diagonally to show
the standard vs. the camera results. For each photo below, the Gretag
Macbeth standard is the top left half of each square, and the bottom right
half is the way the camera photographed that square.
None of the three cameras
reproduced all the squares ideally, but each one tended to alter different
colors. The Sigma did better on flesh tones than the Canon, and about the
same as the Samsung. The photos were taken in full sun, middle of the day.
Conclusions
The Sigma SD14 DSLR is a fine
camera. It has the easiest-to-use interface I have yet experienced, has a
wide variety of lenses to fit it, and takes great photographs. Its infrared
capability makes it unique among DSLRs, and its 14.1 megapixels will allow
enlargements of just about any size.
- John E.
Johnson, Jr. -
Additional References:
Infrared Photography
http://msp.rmit.edu.au/Article_03/04b.html
http://www.rit.edu/~andpph/text-ir-uv-book.pdf
http://dpfwiw.com/ir.htm
MTF
http://bobatkins.com/photography/technical/mtf/mtf1.html
http://www.normankoren.com/Tutorials/MTF5.html#whytest
Vignetting
http://www.vanwalree.com/optics/vignetting.html