
Introduction
If you are “into” HD video cameras, you know that, with only one or two exceptions, they all have 1920×1080 native resolution now, many are 1080p (recording 1080p24 and 1080p30), and that you have a choice of camera storage of tape, hard drive, and memory cards. You also can choose a camera that has either one sensor or three. The one-sensor cameras are generally less expensive than the three-sensor cameras.
You would think that a three-sensor camera would produce a better picture than one sensor, right? Well, there are lots of factors involved. One is how well the sensors are lined up in the camera. This is critical, obviously, for a sharp image. Secondly, the number of pixels on each of the three sensors is not necessarily the same as on a single sensor design. Optimally, each sensor would have 1920×1080 pixels, one sensor each for red, green, and blue. That may be the case for studio cameras, which also have larger sensors (this results in much lower video noise), but it is generally not the case with consumer cameras. The Panasonic AG-HSC1UP is such an example, as each sensor has 560,000 pixels. By using pixel shift, they “simulate” the same total number of pixels that a single 1920×1080 native sensor has (but, in fact, the actual physical number of pixels is less).
A portable hard drive comes with this model, which lets you upload your videos while you are travelling. This comes in handy, as there is only 90 minutes of recording time on the built-in memory card.
Specifications
- Design: 1920×1080 Native High Definition Video Camera
- Sensors: Three 0.25″ (560,000 Pixels Each)
- Recording Format: AVCHD
- Recording Media: SD Card
- Recording Speeds: 6,9,13 Mbps
- Lens: 12x Optical Zoom, f/1.8-2.8
- LCD Monitor: 3″
- Sensitivity: 6 Lux
- Connections: HDMI, Component Video, External Microphone, USB
- Dimensions: 2.6″ H x 2.9″ W x 5.4″ D
- Weight: 0.95 Pounds
- MSRP: $2,099 USA; Includes 40 GB Battery-Operated Hard Drive for Storing Videos While Travelling
- Panasonic
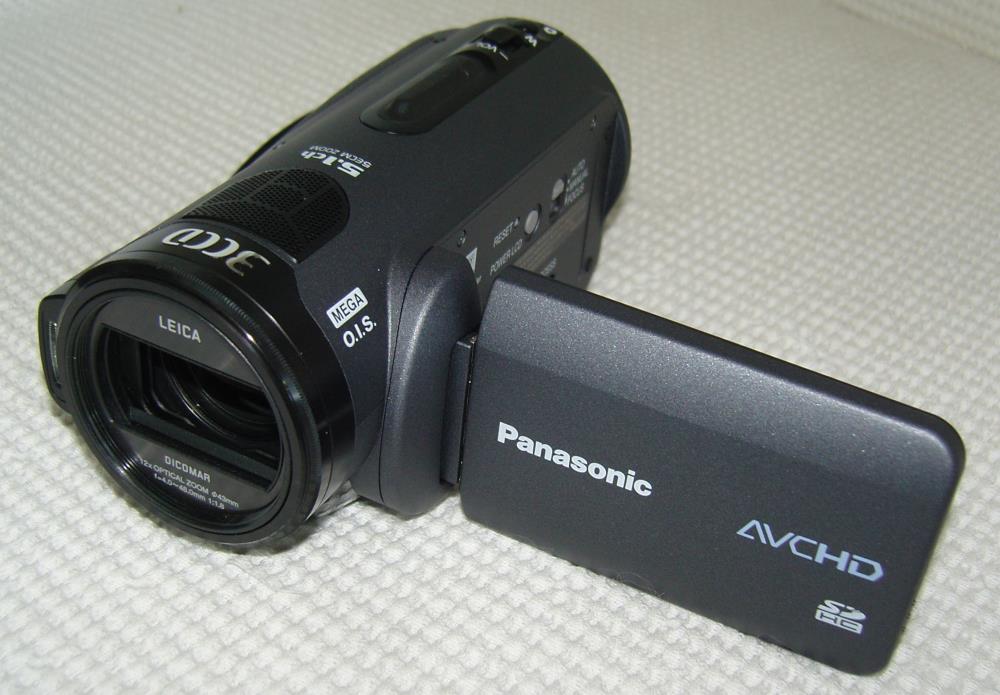
The Design
This is probably the lightest HD camera I have ever used. It does not slide into my pants pocket quite as easily as the Canon VIXIA HF11 that I reviewed, but it is only half the weight of the Canon.
Menus are getting easier to use on digital cameras now. I guess they figured out which items we are likely to use most often, and make them readily accessible.
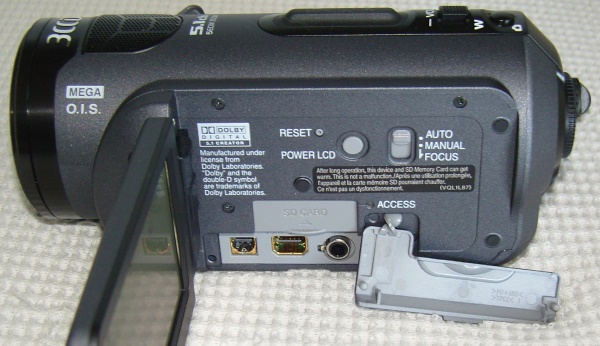
When the 3″ LCD monitor is folded open, there are some jacks for video and audio on the camera body, as well as the SD card slot.
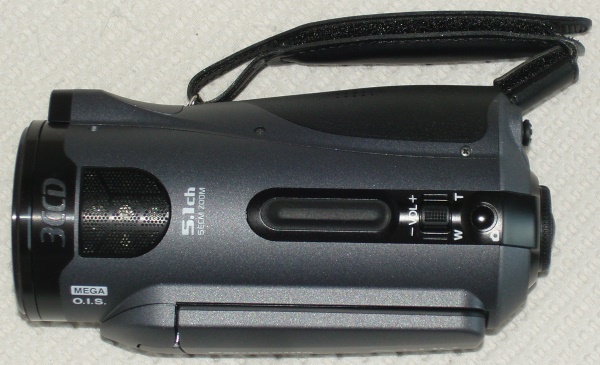
The top of the camera has the zoom control, volume control for the built-in speaker (for reviewing what you recorded), and a button for taking snapshots. Notice at the front of the camera there are five microphone grilles (the grilles cover the microphones). This camera records five-channel Dolby Digital so you have surround sound in your home videos, if you play the files from the camera through the HDMI port. If you transfer the files to your PC for editing, you will need software that can deal with five channels of audio. Otherwise, you will end up with two channels when you burn your DVDs.
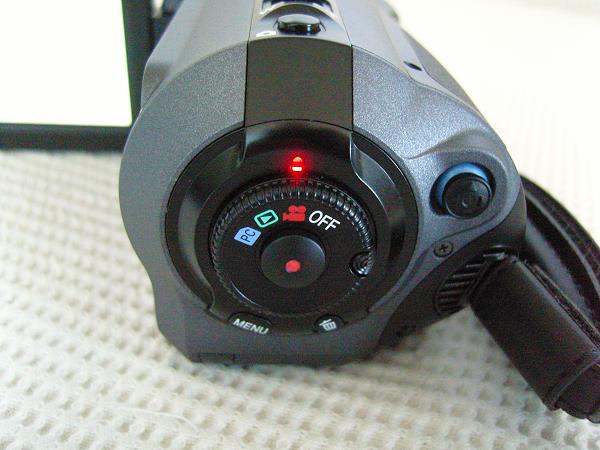
At the rear is the main dial for turning the camera on, setting it to take video (red camera icon), playing back what you recorded (green arrow icon), and connecting it to your PC (blue PC icon) for transferring the videos. The toggle on the far right is used when the Menu button is activated.
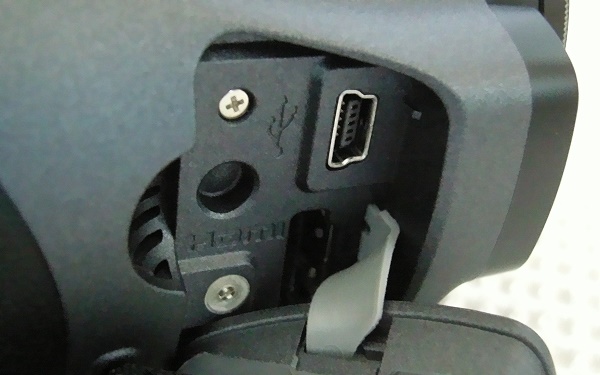
At the right front of the camera is a covered USB jack (top jack) and HDMI jack (bottom jack). You can play the videos directly to your HDTV using the HDMI jack, and the USB jack is used for transferring the video files to your PC.
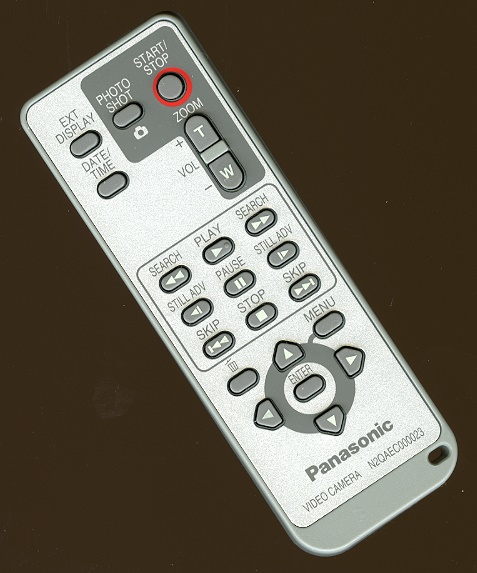
The remote control is very small, but it has all the essential features that you might need, particularly starting and stopping recording when you want to be in the video.
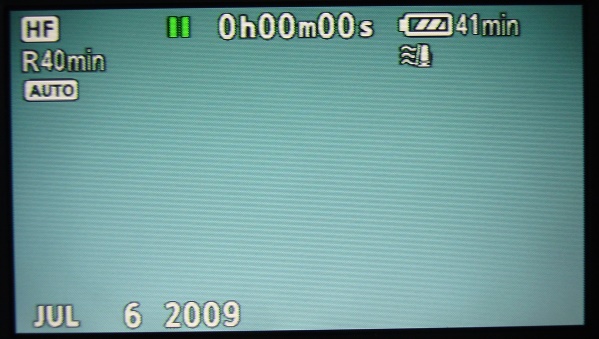
The menu structure is simple. When taking videos, you can see the recording quality (in this case, HF, which is 13 Mbps), how much time you have recorded, Auto vs. Manual mode, and the battery time that is left. When you start the video and then stop, it is stored on the card as an individual file. When you then start the video again, it creates another file, numbered as 00001.mts, 00002.mts, and so on. Each time a video is started, the hour, minute, and second counter is reset to zero. That’s why you get the R40 min indication on this screen. It is saying I have 40 minutes of video on the SD card. At the HF setting, you can record up to 90 minutes.
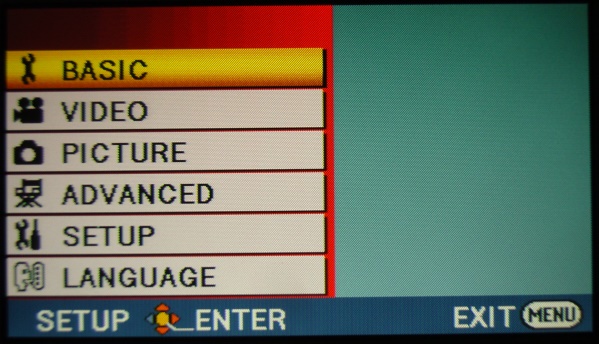
This is the menu that comes up when you press the Menu button. You can assign the recording quality, activate the digital zoom, turn on the image stabilizer, set the time and date, and several other actions. Some features are only accessible if you have the camera set to Manual mode. Otherwise, using the Auto mode, everything is pretty much taken care of for you.
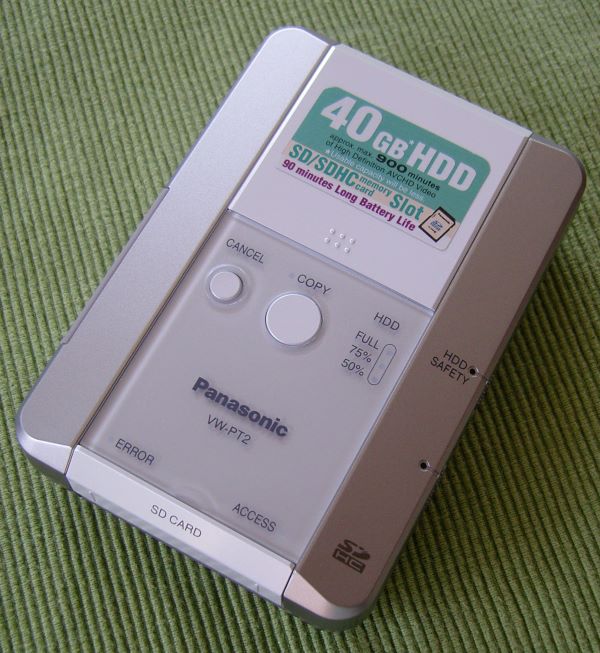
Here is a photo of the included 40 GB hard drive which is designed specifically for transferring the video files from the SD card in the camera to your PC when it is full. It has a rechargeable battery, and is easily carried in your pocket.
In Use
My wife is an avid gardener, and she has so many flowering plants, there is always something in bloom, regardless of the time of year. I took all these screenshots from videos shot at the highest quality (13 Mbps), they are unaltered except for sizing to fit on these pages.
Let’s start with this red and yellow tulip. Red and yellow are the toughest colors for digital cameras, and the colors here have just the right amount of saturation.

These yellow Violas have a more subtle yellow, and the delicate shading is rendered beautifully.

In the reddish vein are these pink Lewisas.

Blue has always been a piece of cake for digital cameras, and these blue Primroses come in loud and clear. The green foliage is perfect too.

An exhibition of Egyptian Pharoh artifacts was on exhibit at the de Young museum in San Francisco during my tests, and I took the Pansonic camera with me. The guides said no photos inside the exhibit, but there was one chair outside near the door where I could take pictures. Below, photo 1 is with Auto White Balance active. The color is too blue. I used PhotoImpact (similar to Photo Shop) to adjust the color to what it actually looked like, and it was pretty simple to do so. The results are shown in the second photo below. Photo 3 was taken in Manual mode, set to Tungsten illumination. The results looked accurate as to what I saw at the museum in terms of the color. You can also perform color adjustments in video editing software, but it increases the rendering time significantly (burning the video to DVD), and depending on the video editing software, you may not be able to fine tune the color balance as I did here with these screenshots in PhotoImpact, which is designed to work with single photos, not video material.


With a hot chocolate from Starbucks in one hand, and the camera in the other, I took my standard grocery store vegetable rack video. The screenshot is about as close to the real thing in terms of lighting and color balance as I have ever seen in our tests.

On the Bench
With the lens set to wide angle, the f/stop spread is very low, with the worst falloff was at the corners (vignetting), being 0.243 f/stops.
At telephoto, the worst falloff was also at the corners, being0.432 f/stops. This is excellent performance.
Resolution (MTF50) results are shown below. The Panasonic clocks in at 488 LW/PH (Line Widths per Picture Height), which is pretty good, but not as good as some other cameras that only have one sensor, such as the VIXIA HF11, which had an MTF50 of 612 LW/PH. In measuring digital snaphot cameras, including DSLR’s, the cycles per pixel data are often mentioned, with 0.25 cycles per pixel being the minimum acceptable and 0.5 cycles per pixel being the theoretical maximum. The Panasonic’s test result is 0.226 cycles per pixel, while the Canon HF11 is 0.283 cycles per pixel. Note that the sensors in the Panasonic camera have 560,000 pixels each, which totals 1,680,000 pixels. For true 1920×1080 native resolution, you need 2,073,600 pixels, so, pixel shift notwithstanding, part of the reason (maybe the entire reason) that the AG-HSC1UP has a lower MTF50 value than the HF11 is that the Panasonic does not have enough pixels to encompass the full 1920×1080 field, while the HF11 does have the full number of pixels.
Chromatic aberration was 0.662 pixels, which is lower than the Canon VIXIA HF11. At twice the price of the HF11, this is probably due to simply having a better lens.
Here is a screenshot of the gray scale test pattern. The Auto White Balance has it looking a little greenish, but all the patches are clearly delineated (some cameras might “crush” the grays so that the last few darkest patches all look black).
![]()
Analysis of the gray scale test pattern shows that the curve follows the first order gamma very well. There is no tendency to dampen the whites. So, you have to be careful when taking videos in bright scenes that have deep shadows to be sure not to clip the whites. The noise analysis (lower half of screenshot) indicates that the noise is about the same in the bright areas as well as the dark areas, suggesting some use of noise reduction.
Using the SG color checker, I got the following results. It looks quite good, especially in the fleshtones and grays.
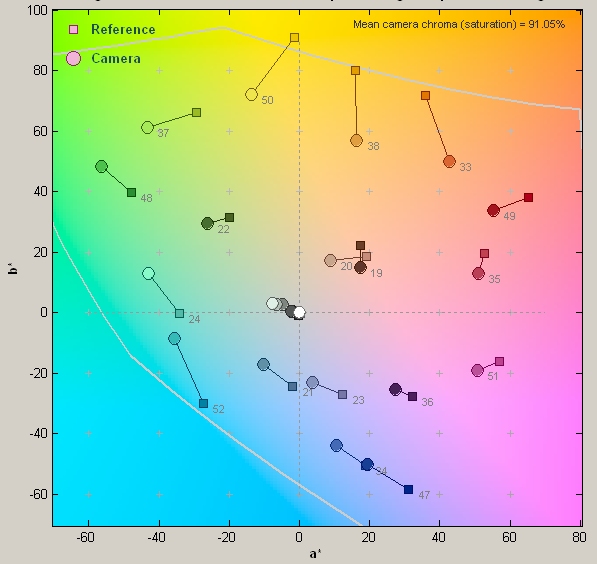
Another way of looking at the color data is called a 2D axbx chart, shown below. It illustrates where the color should be, indicated by the squares, and where the camera reproduced that color, indicated by circles. You can see that the reds are undersaturated and there is a shift towards the yellows and blues being too green. This could be seen in the gray scale test pattern shown above.
Conclusions
The Panasonic AG-HSC1UP High Definition Video Camera is easy to use, has all the features you might want, including a very long zoom lens, but its performance is only modest. Even with three sensors, and a bit less chromatic aberration, the image quality still does not justify the $2,000 price tag. Its highest quality mode is only 13 Mbps, when other cameras that are much less expensive, will shoot at the maximum quality for AVCHD at 24 Mbps. Even with the included portable hard drive to transfer video files while you are travelling, there are better bargains out there.
Now that most new consumer high definition cameras are 1080p, resolution has maxed out. Putting better lenses on the cameras would deliver greater sharpness (MTF50), but to do so would increase the price significantly. This is one reason why the studio cameras are in the $25,000 and up range. The lens is about $10,000 of that price. The current crop of consumer cameras actually do have very good sensitivity in low light, but there is always room for improved noise control, so perhaps that is where we will see product development occur.