Up-sampling, Aliasing, Filtering & Ringing; a Clarification of Terminology
A “Math-free” Primer on Digital Signal Processing
With the advent of 4K video display technology, there have been many questions and discussions about the pros and cons of up-sampling, processing, and re-processing. To those of us who’ve been involved in this hobby since the early 1990’s (or even longer in many cases), many of these discussions sound strikingly familiar. Indeed, while the number of pixels in our home theater video displays has been increasing steadily over the years, the basic mathematical principles governing how analog and digital data work, haven’t changed in many decades.
In this article, I will present some of the basics of digital signal processing, and show how these concepts are the building blocks to understanding, identifying, and discussing some undesirable artifacts in the digital media you consume. I will explain concepts without math so that hopefully everyone reading this will be able to get the most out of it. This article won’t be comprehensive, but I will highlight and explain a few specific terms: up-sampling, aliasing (and anti-aliasing), filtering/smoothing, and ringing. To attempt to keep things simple, I’ll often use one-channel audio as an example of a signal, but the principles are the same for video; the math just gets much more complex (and I hope to avoid any math in this discussion).
Back in the 80’s and 90’s, Laserdisc was the reference for high-quality home video. Then the first “high resolution” projectors came out with the capability to display more lines of video than Laserdisc contained. This brought to market devices called “line doublers” which were essentially de-interlacers, and did not really do any up-sampling as the name “line doubler” implies. Then came “video scalers,” which actually did attempt true upscaling, or up-sampling of the image. Since DVD was also essentially an interlaced source, de-interlacing became important for that format, too (See the Secrets DVD Benchmark Part 5: Progressive Scan). With the advent of HD displays, scaling or up-sampling of DVD came too. Heck if you’re an audiophile, when high-resolution digital audio formats hit the market you also heard analogous (no pun intended) conversations about the pros and cons of up-sampling of audio/music sources.
Today with 4K displays, the “need” (or desire) to upscale the current video standard (1080p Blu-ray) has presented itself again. And as with each previous wave of display resolution followed by upscaling of preceding source formats, similar questions now arise again about how, why and if one should up-scale, and what the pros and cons of such a process might be.
Part One: Digital Sampling and Aliasing
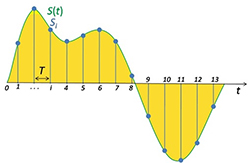
In its simplest form, up-sampling implies digitally sampling a signal at a sampling rate higher than was originally used for the digital source medium (e.g. the CD, DVD, or Blu-ray disc). Most people can picture a simple wave function of amplitude varying with time, and can imagine what sampling that wave means. Most people will picture something like the following image:
Figure 1 (credit “Signal Sampling” by Email4mobile (talk). Licensed under Public Domain via Wikimedia Commons)
So intuitively, up-sampling the signal depicted in Figure 1 would mean simply increasing the number of “samples” shown by the green dots and vertical lines. The dots are stored as amplitude values at discrete time intervals. This is relatively simple stuff, widely understood by most everyone in this hobby. “Good” up-sampling is much more complex, and should involve interpolation and various levels of filtering. But those are details we’ve covered before, and won’t be covered here.
What about aliasing? Many of you may be familiar with an image like this one from the Wikipedia page on aliasing:
Figure 2 Time-domain representation of aliasing
Aliasing occurs when a signal is sampled at a rate that is too low. This typically results in lower-frequency information appearing in the reconstructed signal that wasn’t originally there. In figure 2, the dots are the samples, the red sine wave frequency is too high, so a lower frequency sine wave, shown in blue, is an artifact. This aliased content causes distortion of the signal. But let’s dive a little deeper into what aliasing really is.
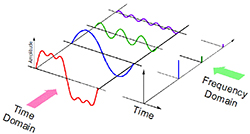
Figures 1 and 2 are only representations of sampling in what is known as the “time domain.” Time domain analysis means analyzing a time-varying signal as a function of time (amplitude vs. time, as shown in Figures 1 & 2). The tricky thing with digital sampling theory is that you can’t just think of it in time domain only. To truly understand sampling, you must also understand what happens in the frequency domain, and frequency domain is funky. To analyze a signal in frequency domain means converting the math from functions of time to functions of frequency. This means the main variable becomes Hz instead of seconds. Frequency domain includes abstract concepts like negative frequencies and sampling-induced aliases. To start, a good basic representation of the relationship between time and frequency domains is something like this image:
Figure 3 (credit)
In Figure 3, we see the red signal which is a mathematical sum of the blue, green, and purple signals. If you convert (transform) the red signal from time domain to frequency domain, you get three lines as shown in the right portion of the figure. Each line corresponds to a specific frequency contained in the original (red) signal, and the height of the line indicates the relative magnitude that frequency has compared to the other frequencies. The red signal doesn’t show up at all in the frequency domain, since it is really just a conglomeration of other frequencies; only the constituent parts (the “frequency content”) of the red signal show up.
So what happens when you digitally sample the original signal? In time domain it would look similar to Figure 1 above, but how does that look in the frequency domain? In a word: weird. Before that though, let’s just consider what some real signals look like. In Figure 4 below, we see a real signal in the time domain on the left, with its frequency domain depiction on the right:
Figure 4 (credit)
Think of time domain as when a signal (e.g. one or many sine waves) occurs and the frequency domain as what frequencies the sine waves are.
Many readers may now be thinking, “What the heck… negative frequencies?” Yes, any real, time-varying signal, when transformed to frequency domain, will have negative frequency content that is the mirror-image of the positive frequency content. It’s strange, yes, but it’s a fairly simple mathematical outcome that can’t be avoided. So what is a “negative frequency?” When it comes to sound and video, I don’t know, quite honestly! It’s a tough concept to grasp. However, if you consider a rotating wheel that rotates at a certain frequency, it’s not hard to see that we could define a clockwise rotation to be positive frequency, and a counter-clockwise rotation to have a negative frequency. Since most signal analysis math uses polar (rotational) coordinates, this actually works well. Another way to think of it is that it’s just a mathematical fact, similar to how the square root of 4 is both +2 and -2. There are “multiple solutions” to the square root of 4. And, similar to imaginary numbers (square root of -1), the concept is important even if it’s not meaningful in the “real world.” If you’re going to design (or understand) digital signal processors and filters, you need to account for the negative frequency content, and in some cases you can even exploit it (although I won’t cover that here).
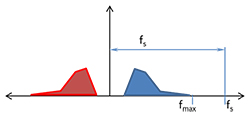
So, what then happens when we digitally sample an analog signal? Well, by sampling the signal, we’re basically making a copy of the content of that signal, so we can reconstruct it later, right? Indeed, that’s exactly what we see in the frequency domain: copies of the original signal, including the negative half. In fact we get infinite copies of the signal, spaced apart in the frequency domain by the sampling frequency. Let’s consider this pictorially, with a cartoon of the frequency domain part of Figure 4:
Figure 5 Frequency domain of a signal like that in Figure 3
In Figure 5, the positive frequency content (in blue) has a maximum value at fmax. Above fmax, there is no appreciable content to the signal. If we digitally sample the signal at a sampling frequency of fs, we get an infinite number of copies of the signal, each spaced apart on the frequency axis by a distance of fs, the sampling frequency. This is shown below in Figure 6.
Figure 6 Digital sampling results in copies of the original signal in the frequency domain
How can this be? My non-math explanation goes something like this: When you digitally sample something you are left with a data set. That data set can be used to re-build the original analog signal. So, within that digital data set is a “copy” of sorts, of that original signal. However, there exists more than one “solution” to the data set; there is more than one signal that the data set could define. Many versions of the original signal would fit just fine into the set of digital samples. So the number of “solutions” to the digital data is infinite. To visualize this, look again back at Figure 2. Now imagine that the “original” signal is the blue sinusoid. It was properly sampled and can be properly reconstructed. But there’s a higher frequency “copy” of the blue sinusoid that could also fit the digital data set, namely the red sinusoid.
Now back to Figure 6. Some readers familiar with the “rules” of digital sampling may start to guess what’s going to happen next. Even in my cartoon above, fs is obviously too close to fmax. Most audio/video hobbyists have heard of the Nyquist theorem (also called the Nyquist-Shannon sampling theorem), which states that in order to fully reconstruct a signal from digital samples, the sampling rate must be greater than twice the highest frequency information contained in the original signal. But there’s a misleading statement contained in that wording of the Nyquist theorem. I wrote, “in order to fully reconstruct a signal” which implies that if you don’t sample at or above the Nyquist frequency you won’t be able to reconstruct the signal. This is not true. You can still reconstruct the signal, the problem is that you will get some extra copies, or “aliases” mixed in there too, and adding frequencies to a signal distorts it (refer back to Figure 3 for an example of adding frequencies; if what you wanted in Figure 3 was the blue curve, but you unintentionally added the purple and green as noise then what you get is the red curve, which has the same fundamental tone as the blue, but with added noise & distortion). As drawn, Figure 6 doesn’t yet show any errors. This is because I left out some of the copies that result from digital sampling, namely the copies of the negative frequencies:
Figure 7 digital sampling results in copies of both positive and negative frequencies
Remember, when we digitally sample a signal, we get an infinite number of copies of the signal in the frequency domain, spaced apart by the sampling frequency. This means the blue and red are copied in both directions, ad infinitum. Copies of the red (negative) original signal that land in the positive frequency region, are now real, positive frequencies that can interact with our original (blue) signal. In Figure 7, we can see that part of an alias of the negative frequency content overlaps with our original (blue) signal. This content would show up as a distortion in the original signal after the digitally sampled data are converted back to an analog signal. Not surprisingly, this problem is referred to as aliasing. Each copy of the signal in the frequency domain is called an alias, and when a signal is sampled at less than the Nyquist frequency, the original signal is distorted by one of the aliases getting added to it.
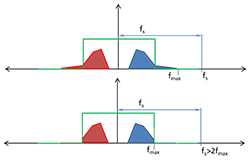
There are generally two methods to fix the aliasing problem with digitally sampled signals: filtering the original signal, and/or sampling above the Nyquist criterion. Let’s consider what these solutions would look like in the frequency domain.
Figure 8 Low-pass filtering of a signal shown in Frequency domain
In the frequency domain, an ideal low pass filter is achieved by simply multiplying the source signal by a unit step function. This is depicted in Figure 8, above: what exists inside the filter remains unchanged, and what exists outside the filter is multiplied by zero and thus removed. Such idealized “brick wall” filters are not attainable in real-time signal processing (they are attainable in post-processing), but the concept will suffice for the purposes of this article. Notice in the bottom part of Figure 8, the new fmax of the filtered signal is lower, such that the original sampling frequency is now greater than twice fmax, satisfying the Nyquist
theorem. Now, when the filtered signal is sampled, the aliases do not overlap:
Figure 9 Anti-aliasing via Low-pass filtering of the source signal.
The other solution to the aliasing problem is to simply sample the source data at a higher sampling frequency. Consider again, Figure 7 above. Let’s say we increase the sampling frequency to more than 2X fmax. Here’s what that will look like:
Figure 10 Frequency domain of a correct Nyquist sampling showing no aliasing
Using a high sampling rate is in many ways the best solution to the aliasing problem: as can be inferred from Figure 10, the higher the sampling rate, the further spaced apart the aliases will be, minimizing any overlap. However, it’s often not practical. High-rate sampling hardware is not only expensive, it results in much larger digital data files. With the progress of Moor’s Law though, high speed digitizers are less expensive, and high-capacity digital storage has become quite affordable. Thus we have the current high-definition world: SACD, DVD-Audio, HDTV, Blu-ray and 4K video, all of which employ higher sampling rates than previous technologies.
In defense of high-resolution audio (e.g. DVD-Audio) and its higher sampling rates, it has been said that the Nyquist frequency is not enough. This is not true. Mathematically the Nyquist criterion is correct, and sufficient. The problem is that real-world signals always contain SOME content above half of the sampling frequency, so in reality we aren’t really sampling above the Nyquist frequency. In fact, it could be argued that real-world signals don’t have a Nyquist frequency; there is always higher frequency content there. But at some point the amplitude of the higher frequencies is so small that you don’t care anymore; you either can’t hear it or you can’t see it.
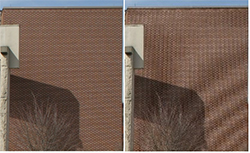
So, what does all this mean for 4K video? In video (and still digital photography), aliasing is often seen (and referred to) as “moiré” patterns. Moiré patterns are the low frequency aliases showing up in the reconstructed digital picture. Visible aliasing doesn’t always result in moiré patterns, but they are the most recognizable. Another very well-known example of aliasing in video is the classic wagon-wheel effect, where the wagon wheel (or helicopter blades) appears to be rotating slower, or even backwards when sampled by the video frame rate. The difference between moiré and the wagon-wheel effect is that one is spatial and the other is temporal. With video, it gets really complex, since video varies both spatially (a paused image may show aliasing) and temporally (e.g. the wagon wheel). Spatial data are mathematically similar to temporal data, except that the primary variables are size (length, distance, etc.) and resolution, rather than time and frequency. For simplicity, I’ll continue to use “time domain” and “frequency domain” though, even when referring to spatial data.
Both moiré and wagon wheel affects can be solved with the methods described above: either filter out the high frequency stuff, or use a higher sampling rate, or best, do both. In the case of moiré patterns, a higher sampling rate means higher resolution digital cameras and displays. Below are two images (again from Wikipedia) demonstrating moiré pattern examples of aliasing:
Figure 11 Properly sampled image of brick wall (left), spatial aliasing in the form of a moire pattern (right). (Credit “Moire pattern of bricks small”. Licensed under CC BY-SA 3.0 via Wikimedia Commons)
Aliasing in digital images can happen if either (or both) the digitizer (recording camera) or the display (HDTV) have insufficient resolution. Usually, the source/digitizer is higher resolution than the display. Most recent movies whether they are from film or a digital source are digitally mastered with 4K resolution, before they are transferred down to Blu-ray resolution. The process of transferring from 4K to 1080p can result in aliasing. Similarly, attempting to display a 1080p test pattern on a HDTV that can’t quite resolve 100% of the 1080p resolution will result in moiré patterns. The move to 4K resolution displays in the home helps solve part of this problem, but one still must rely on good source material, and/or good up-conversion algorithms.
Part Two: Ringing and Filtering
Generally, what we see as ringing in video can be caused by multiple things with the same, or a similar, effect. Before I talk about the causes of ringing however, let’s try to understand what it is in both time domain, and frequency domain. In video images, ringing usually happens around a sharp transition, some feature in the picture where the image goes from light to dark (or vice versa) quickly – in a matter of a couple pixels or so. In digital audio, ringing occurs around sharp transient sounds like a gunshot, or a cymbal crash, etc. Such a transition is mathematically called a either an impulse (e.g. a gunshot) or a step function. (Note: both square wave and box-car/rectangular functions are combinations of alternating step functions.) Technically, there is no such thing as a true impulse or step function in the “real world,” because these types of functions have instantaneous changes, and all real-world changes take some amount of time. How do electrical systems reproduce such transients then? Take another look back at Figure 3:
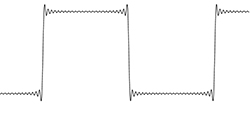
The red curve in Figure 3 is an approximation of a square wave. It starts as a sine wave (blue) which is the “fundamental” frequency of that particular square wave, and as you add higher and higher harmonics (the green and purple sine waves) with smaller and smaller amplitudes, the red curve becomes more and more shaped like a square wave. Add more high-frequency harmonics, and you get something like this:
Figure 12 Square wave approximation with 25 harmonics
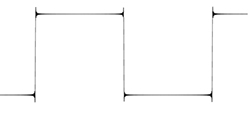
In Figure 12 the transitions are more vertical and the plateaus more flat than the red curve from Figure 3. However it is still not quite a square wave. In Figure 13 below, even more harmonics have been added to the function:
Figure 13 Square wave approximation using 125 harmonics
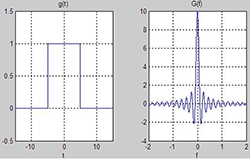
Figure 13 is very close to a square wave, but it’s not perfect. It has some overshoot at each transient, and some ringing after the over shoot. The point here is that with discontinuous functions like an impulse or step, there will always be some overshoot and ringing when approximating the function with a finite number of harmonics; it’s unavoidable. The next important thing to understand is how these functions behave between time and frequency domains. Without going into the math too deeply (or at all, preferably), it is important to understand that any such function (impulse or step) in one domain, will result in “ringing” in the other domain ( I should point out that “ringing” in the frequency domain is referred to as “ripple”). So a boxcar (rectangular) function in frequency domain, results in ringing in the time domain, and vice-versa:
Figure 14 Boxcar function in time yields the “sinc” function in frequncy domain, and vice-versa
For the purposes of visualization, you can ignore the scales in Figure 14 and the two images are then interchangeable; the boxcar function is the frequency domain version of the sinc function in time, and vice-versa. The boxcar and sinc functions are known as “Fourier pairs.”
So once again, what does this all mean for 4K video? Here’s where we can tie it all together (hopefully!) Going back to Figure 8 above, the green function representing the low-pass filter is essentially a box-car function. This kind of filter is known as a sinc filter or box-car filter. It is an idealized low-pass filter, also called a “brick wall” filter. As we’ve just discussed, any discontinuous (or similar) function in one domain causes ringing in the other domain. So if we apply an abrupt filter in the frequency domain then the result is ringing in the time domain (your original signal) which is usually undesirable. One solution to minimize time-domain ringing as a result of filtering is to use a less abrupt filter. The trade-off is that your filter is less effective at attenuating high frequencies.
Since the primary method for anti-aliasing is to low-pass filter the original signal (as described in Part 1), a common side-effect of anti-aliasing is ringing in the resulting signal. Many high quality anti-aliasing methods implement complex algorithms that minimize ringing artifacts, which are beyond the scope of this article. Add to this, the fact that “real time” DSPs (processing that occurs as you are listening to and/or watching the content) introduce a whole new ball of wax (also beyond the scope of this article) to which I have alluded when I said that idealized “brick wall” filters are only possible in post-processing, not real-time processing. Suffice to say, a good DSP engineer spends a lot of time tinkering with filter design. Some filters have a smooth roll-off with minimal ringing (e.g. Butterworth, or Gaussian), while others attempt to strike a balance with some ringing but a steeper roll-off (e.g. Lanczos, or Chebyshev). For video, a DSP engineer may sometimes actually want a little bit of ringing, as it can improve “acutance” or apparent sharpness. Most home theater videophiles eschew edge-enhancement of any kind, but it can be useful for some applications.
One final topic to tie this all together: up-sampling. At the beginning of part 1, I wrote that “good” up-sampling should involve interpolation and various levels of filtering. In fact, interpolation for up-sampling is actually achieved with the use of a filter. If you consider a set of digitally sampled data, defining a curve, much like the green dots in Figure 1, then the simplest and worst reconstruction of the original wave would be to draw straight lines between the data. This straight-line reconstruction would contain a lot of high-frequency data due to the sharp corners. To interpolate a smooth curve, you would apply a filter to the data. Interpolation for up-sampling is similar in concept to this, and in fact interpolation algorithms are often referred to as filters in the DSP world. So if you’ve paid attention this long, you can predict one of the artifacts of up-sampling: ringing! We’ve just learned that filters can cause ringing, and since up-sampling is achieved with a filter, we should expect some ringing as an artifact of up-sampling as well. Again good up-sampling algorithms will minimize artifacts, and most do it so well that you won’t notice them in the final product, but now you understand what to look for as red flags indicating the use of a poor, low-end digital signal (video or audio) processor.
Conclusions
Hopefully this article has provided you a window into the complex world of digital signal processing, such that you can now understand the causes of, and better identify, undesirable artifacts in the digital media you consume. (Bonus points to anyone who can identify the double pun in that sentence; post in the comments!) I tried to write this with as much emphasis on concepts, and as little math, as possible so that everyone and anyone could get something out of it. We’ve discussed basic sampling theory, what aliases are and how they come about, how digital filters work, and how ringing plays into it all. There is a LOT more out there though; these are just a few basic topics. Maybe this article will give you the tools to tackle slightly more complicated books or articles on these topics. If you’re so inclined this paper from AT&T Labs is a good next step; it’s a glimpse at what some engineers are working on every day to improve your experience with your digital toys and tools:
Please post any thoughts or feedback in the comments. Thanks!


