
Introduction
EveAnna Manley is a very interesting personality. She is great fun to talk to, and she knows as much about tube circuit design as anyone I have ever met. I have never asked her a question about circuit design that she couldn’t answer.
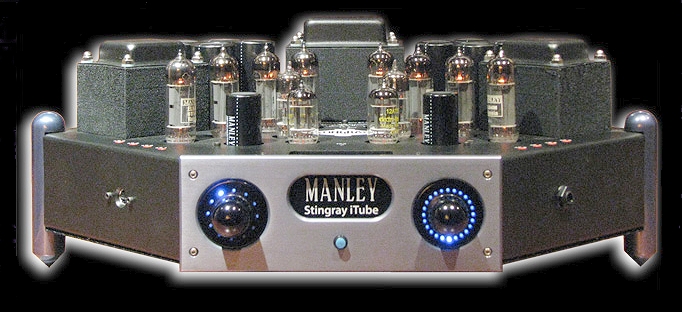
Her hi-fi products are just as unique. They are all named after fish, in the current case, the Stingray, which has been around in her arsenal for a while. But, the latest version is even more unique. It has an iPod dock right on the front. When you put your iPod in the dock, it blocks your view of those warm and cuddly little tubes, but so be it.
Specifications
- Design: Stereo Tube Integrated Amplifier
- Power: 18 Watts RMS x 2 in Triode Mode, 32 Watts RMS x 2 in Ultralinear Mode
- Tube Complement: Two 12AT7EH Input, Two 6414 Driver, Eight EL84 Output
- MFR: 15 Hz – 58 kHz, -1 dB
- THD+N: 1.5% at Full Output
- RCA Input Impedance: 12 kOhms
- Optimum Speaker Load: 5 Ohms
- Inputs: 3 x Stereo Line RCA, iPod Dock, Tape Loop with Bypass Switch
- Outputs: Five-Way Speaker Binding Posts, Rec Out, Subwoofer Out, S-Video (from iPod), 1/4″ Headphone Jack
- Remote Control: RF and IR
- Dimensions: 7.5″ H x 19″ W x 14″ D
- Weight: 35 Pounds
- MSRP: $3,400 USA
- Manley Labs
The Design
The iTube is an integrated tube amplifier. The input stage (voltage gain) is handled by two 12AT7 dual triodes, the driver stage by two 6414 tubes which are similar to 12AT7’s but can deliver more current to the output stage than the 12AT7, and the push-pull output stage consists of eight EL84 pentodes. The power supply has two sections: an unregulated tube supply, and a linear, regulated supply for the logic circuitry.
In a push-pull amplifier, the + and – halves of the waveform are handled by two separate sections of the amplifier circuit. In order to do this, the input signal has to be split and one of the split sections inverted. This is accomplished by a “phase-splitter”, and in the case of the Stingray, this is done in the driver stage, which is configured as a “long-tail pair”, which is a classic tube circuit. Shown below is a generic schematic of the long-tail pair phase-splitter using a dual triode. The “long-tail” refers to the resistor at the bottom of the schematic. The phase split signal is then fed to the output stage. (I am indebted to my friends at DIYAudio in coming up with a general schematic for illustrating the long-tail pair.)
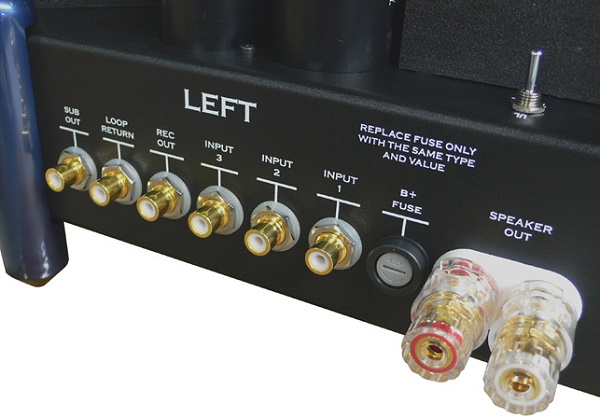
The output transformer only has one tap, which has been optimized for a 5 ohm load, connected to the five-way speaker binding posts. Manley has found this to be optimum, rather than having several output taps. There is a headphone jack (1/4″) on the right hand side of the chassis, and an S-Video output jack (for use with Video iPods) on the left hand side. A Rec-Out and Loop Return (for recording), as well as a Sub-Out (for use with a subwoofer) complete the rear panel layout.
Speaking of transformers, the iTube is switchable between “Triode” mode and “Ultralinear” mode, using a toggle on each side of the amplifier, one for each channel. The EL84 output tube is a power pentode, but it is wired here either as a triode, or in ultralinear mode. The suppressor grid is always connected to the cathode, and the connection is inside the tube, permanently. This, in fact, confuses the pentode designation. The signal and bias go to the control grid, and the screen grid is connected either to the anode for triode mode, or to a dedicated tap on the output transformer for ultralinear Mode. This produces linearity (lack of distortion) that is part pentode and part triode.
Some consumers feel there is a difference in the sound quality between the two modes. I did not hear any difference, and in fact, the ultralinear mode bench tested a bit better, so I did nearly all of my listening in the ultralinear mode. You can see one of the toggle switches just above the Speaker Out posts in the photo above. (You can switch between modes while the amplifier is on, to compare the sound, but don’t switch back and forth many times in a row, since there is high voltage running across that connection.)
Shown below is a generic schematic of how ultralinear mode is wired to the output transformer (red arrows).
Powering on the iTube involves a rocker switch on the rear panel. Then you press the blue button (the standby button) in the center of the front panel. After a few seconds (and some flashing lights for fun), the blue light in the center turns off and the amplifier is ready for use. However, it should be allowed to warm up fully (about half an hour) before any serious listening. Here is a video showing the power-on procedure.
![]()
The Stingray comes with a voltmeter for the purpose of setting the bias voltage (voltage applied to the grid) on the eight output tubes about once each year, and definitely if you change tubes. The process involves placing the ground probe (black) of the voltmeter into the grounded jack on the front of the Stingray, and the hot probe (red) in each of the eight jacks along the front right and left sides of the Stingray, one at a time, and adjusting the bias voltage. The voltage is adjusted by inserting the included small wooden screwdriver into the respective hole at the top rear of the Stingray (there is a row of eight holes), and turning the screw until the meter reads 250 mv. Here is a video demonstrating the bias adjustment procedure.
You can set the input level of each input according to the output of the sources that are connected to them (such as when one source has more output voltage than another). This is accomplished by first selecting the input you want to adjust, pushing the input selector knob in for 2 seconds and releasing it, rotating the input knob through its three menus (DIM, Input Level Adjust, Remote Control Configuration) and selecting the Input Level Adjust, then adjusting the input level using the volume control, and finally, pushing the input selector knob in again.
Secondly, there is what’s called the DIM control, which lets you turn down the volume to a preset level for such things as having to answer the telephone. To do this, follow the same instructions outlined above, except that you select the DIM menu instead of the Input Level Adjust. Balance between left and right channels is achieved by pushing the volume control in for 2 seconds, releasing it, and turning the volume control clockwise to reduce the level of the left channel, and counter clockwise to reduce the level of the right channel. In all cases, to exit the various modes for changing the input level, the DIM, and chanel balance, push the respective knob in and release it quickly. Finally, you can adjust the brightness or “twinkle” of the blue LEDs by pressing both the input selector and volume control in for 2 seconds, releasing them, then cycling through the input selector positions, and adjusting each feature using the volume control. All of these features are controlled by a microprocessor.
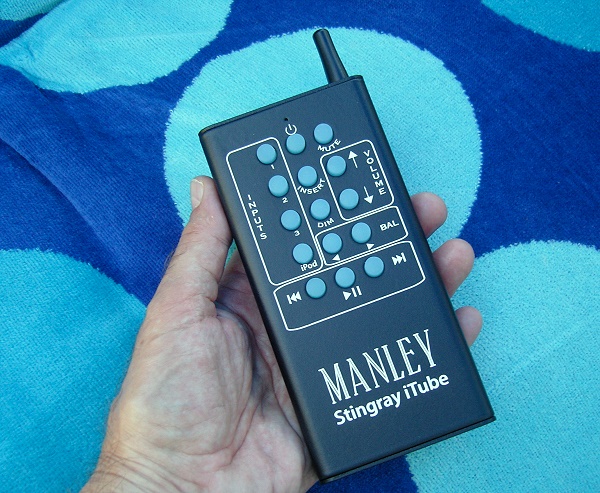
The included remote control is very unusual. It looks like a “walkie-talkie” from the 1980’s. Certainly, you won’t have any trouble locating the buttons. You can select the input, adjust the volume and balance (relative volume of left and right channels), and navigate the menus of an iPod (to select albums and tracks to be played) when it is being used. It operates by your choice of IR or RF, so you can control the Stingray from another room. To select IR or RF, set the input selector to input 4, push the input knob in for 2 seconds, release it, and then turn the input selector to the 2 o’clock position for RF control, or 3 o’clock for IR. If both the 2:00 and 3:00 LEDs are illuminated, then the RF and IR modes are both active.
In Use
I tested the Stingray iTube with an OPPO BDP-83SE/NuForce universal Blu-ray player and a pair of Krix Equinox bookshelf speakers that have a nominal impedance of 6 ohms. Cables were Emotiva, Nordost, and Legenburg.
Switching back and forth between triode and ultralinear mode, I was unable to discern any audible differences, so I settled in to just using the ultralinear mode because it delivers more power. Needless to say, even in ultralinear mode, 32 watts output is not a lot of juice compared to most solid state amplifiers, but it is plenty for easy listening, and assuming your speakers are reasonably efficient, it is enough.
Chamber music was the relaxation du jour for me with this amplifier, and there is plenty of it out there.
This SACD has Telemann sonatas and other quiet (relatively) works that I particularly enjoy when I am reading. Pauline Oostenrijk plays the oboe as sweet as Belgian chocolate, and frankly, at my age, I like feeling my heart rate decrease along with my blood pressure. This kind of music, played through a terrrific little tube amplifier like the Stingray, is a joy. Soft, delicate, intricate, without edginess. That’s tubes for ya’.

Piano sonatas are another kind of soft easy music that I love. This recording of Mozart’s Piano Sonatas Nos. 310, 331, and 333 are beautifully rendered with the Stingray. Sometimes I wonder if reviewing such products is really considered a job. Sometimes, yes. But in this case, no. Too much pleasure to be considered work.

On the Bench
All distortion measurements were made within an 80 kHz bandwidth and into an 8 ohm load. The first few tests compare triode mode with ultralinear mode. The yellow graph lines represent the left channel, and the red lines are the right channel.
At 1 kHz input, and 5 volts output into an 8 ohm load, the measurement was 0.20% THD+N in triode mode, and 0.10% in ultralinear mode. Overall, there really wasn’t much difference.
I used a 1 kHz sine wave stored on my iPod to obtain the graph shown below (the other test signals were generated by my Audio Precision). The iPod dock takes the analog output from the iPod. It does not take the digital bitstream. So, the input to the Stingray is from the output of the iPod’s own DACs. The analog output from the iPod is at full volume, and you cannot lower it using the iPod’s control panel. You will need to lower the input level using the input level adjustment mode described in The Design section above. The resulting spectrum is irregular, possibly due to the iPod’s inexpensive analog output amplifiers being at full output. Here is a video of how to set up your iPod with the Stingray.
Inputting 19 kHz and 20 kHz sine waves, the B-A (20 kHz minus 19 kHz) peak at 1 kHz was 47 dB below the fundamentals in triode mode, and 54 dB below in ultralinear mode. There are also some slight differences in the height of the side peaks on either side of the 19 kHz and 20 kHz peaks as well as around the 40 kHz and 38 kHz harmonic peaks. Really, not much difference between the two modes, so I only measured in ultralinear mode from this point on.
IMD was 0.38%
My test environment has some electrical noise in the 20 kHz range, but the Manley rejected it as seen in the graph below. I turned the volume all the way up for this test, but no input signal was applied. Some amplifiers don’t reject it, and when it shows up, it is usually about 10-15 dBv in height.
THD+N vs. Frequency indicated 0.3% or lower distortion from 20 Hz to 20 kHz. The differences in the channels was probably due to differences in the bias voltage of the eight output tubes. When I measured them, there was a variation of about 20 mv. I did not adjust them to exactly 250 mv. Although the instruction manual says that anywhere between 230 mv and 270 mv is OK, but I would suggest trying to set them all right at 250 mv or as close as you can get them.
Output of the Manley Stingray showed a hard knee at 30 watts into 8 ohms, and clipping (1% THD+N) at 32 watts.
The measured frequency response was flat between 20 Hz and 20 kHz.
Conclusions
The Manley Stingray iTube is a product that I see in a consumer’s den or, better yet, in a college student’s dormatory room. Most young people these days take all their music with them on their iPod. The Stingray is a way of listening to that music catalog on a product that is considered “Retro” and very cool, not to mention that it sounds very good. If were still in college in that dorm room I had at the University of Washington, the Stingray would be sitting next to my desk, and there would be a non-stop trail of other dorm students in and out of my room wanting to look and listen.